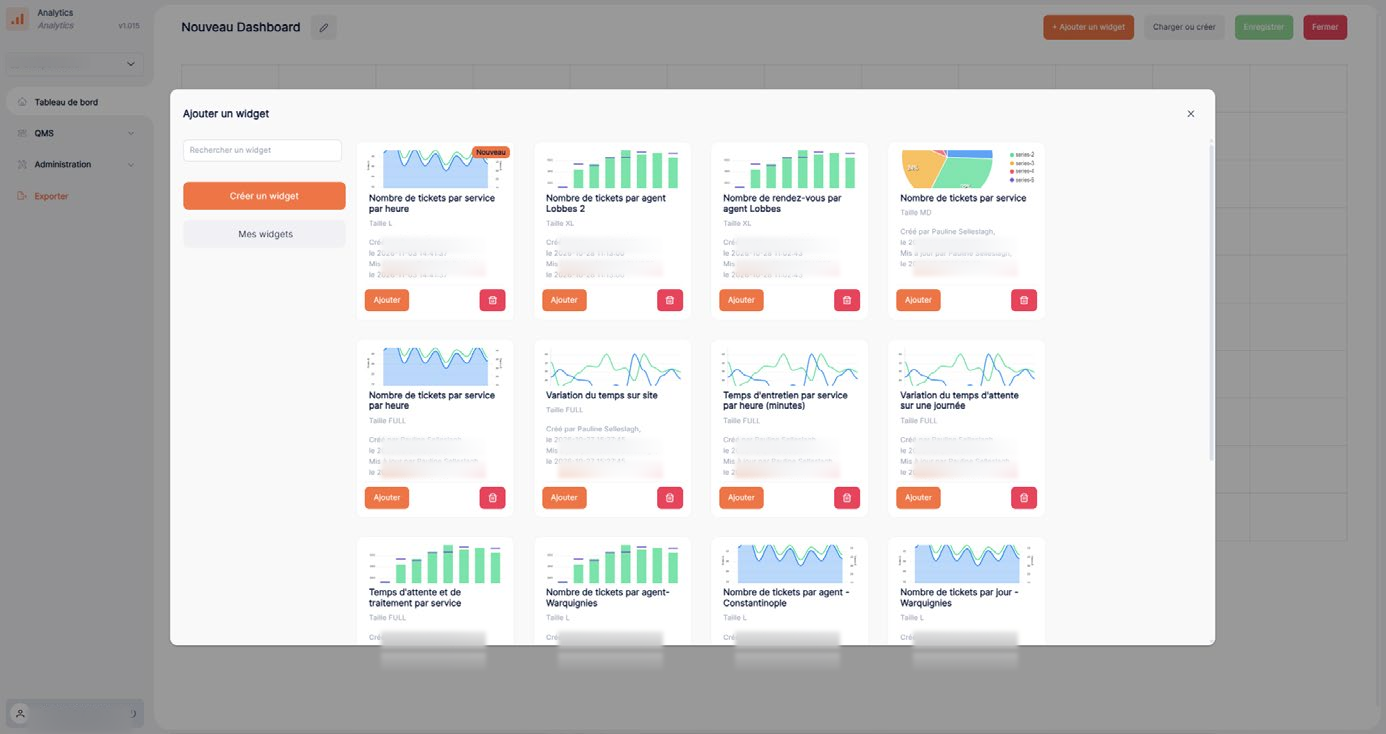
Add and configure a widget
A widget is a visualization (such as a chart or another statistical representation) that you place on a dashboard.
Understand the configuration options
- Widget type: determines how the data is represented.
- Data or metrics: define what is displayed.
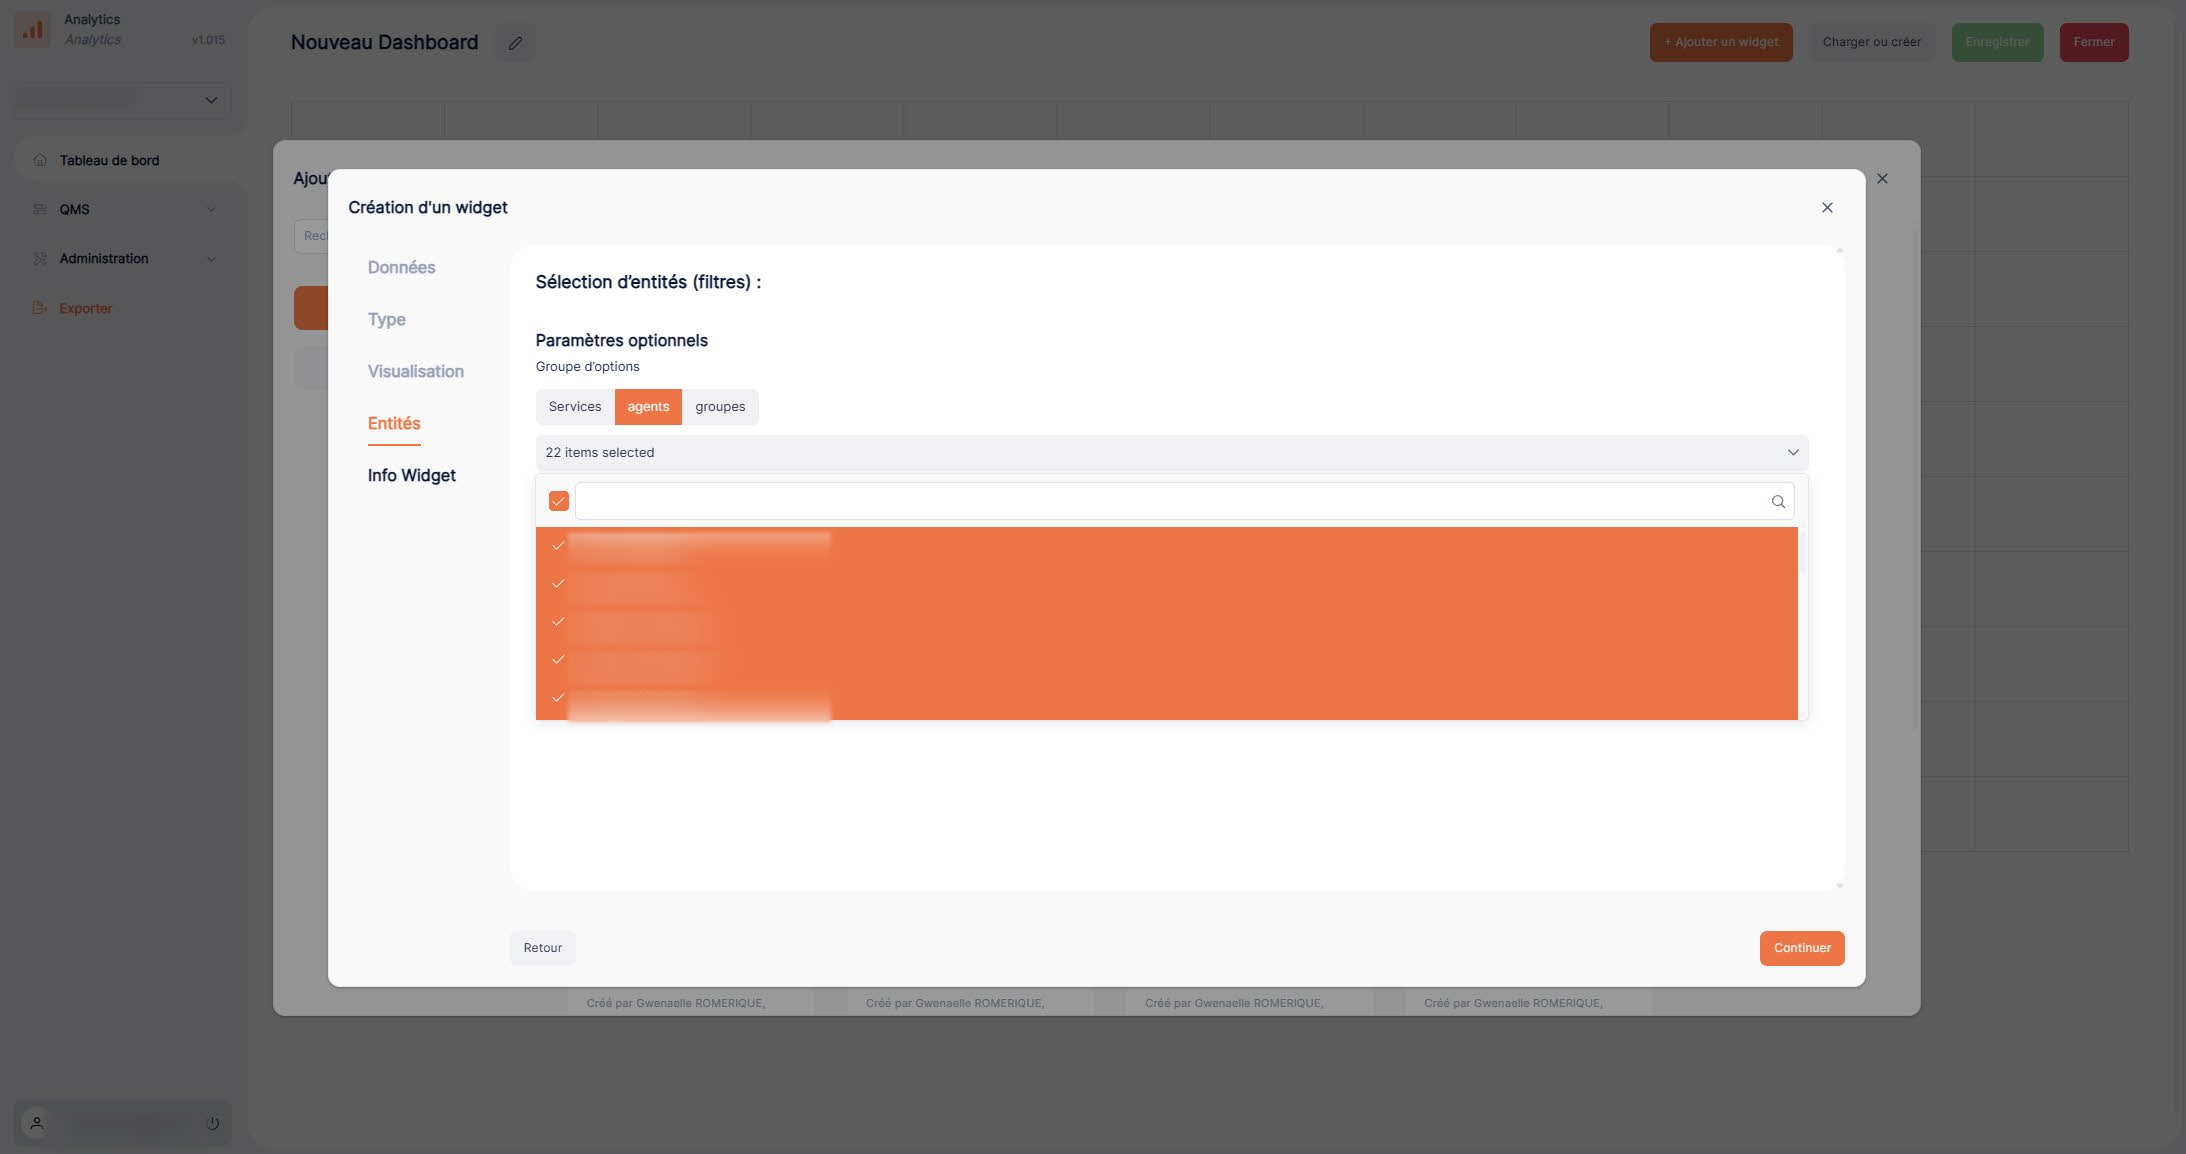
- Filters: narrow the scope being analyzed.
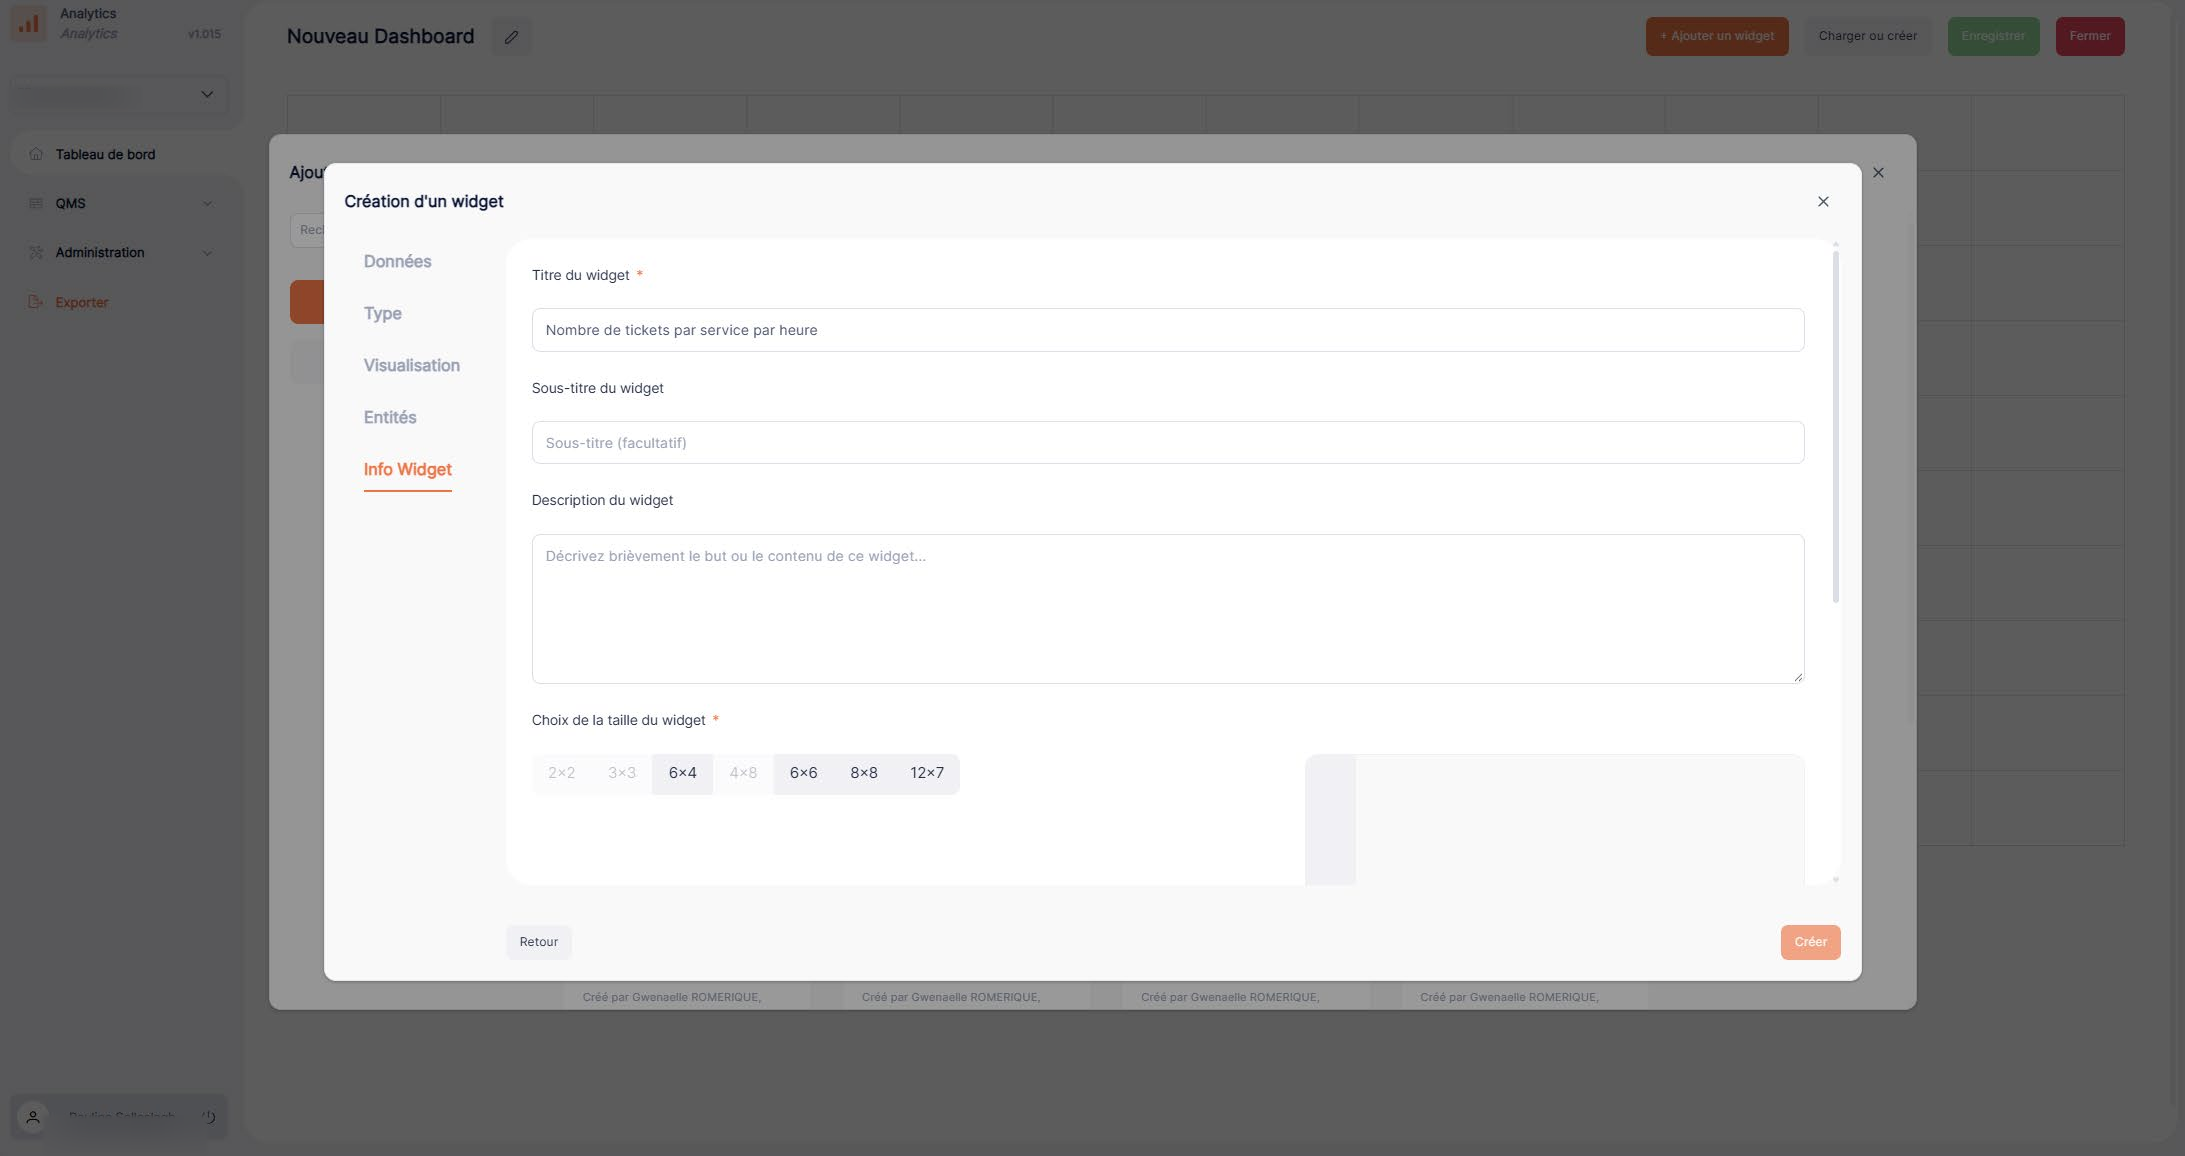
- Name and appearance: make the dashboard easier to read.
For example, to track changes over time, choose a time-based visualization when available. To compare several categories, a bar chart may be easier to read. Choose from the types available in the creation wizard.
Checks before confirming
Check the data source, selected metric, filters, title, and preview readability in turn. If a chart appears empty, first check its scope and period before concluding there was no activity.
Configuration steps
1. Start adding a widget
On the dashboard, open the add-widget action. Choose an existing widget or start creating one.
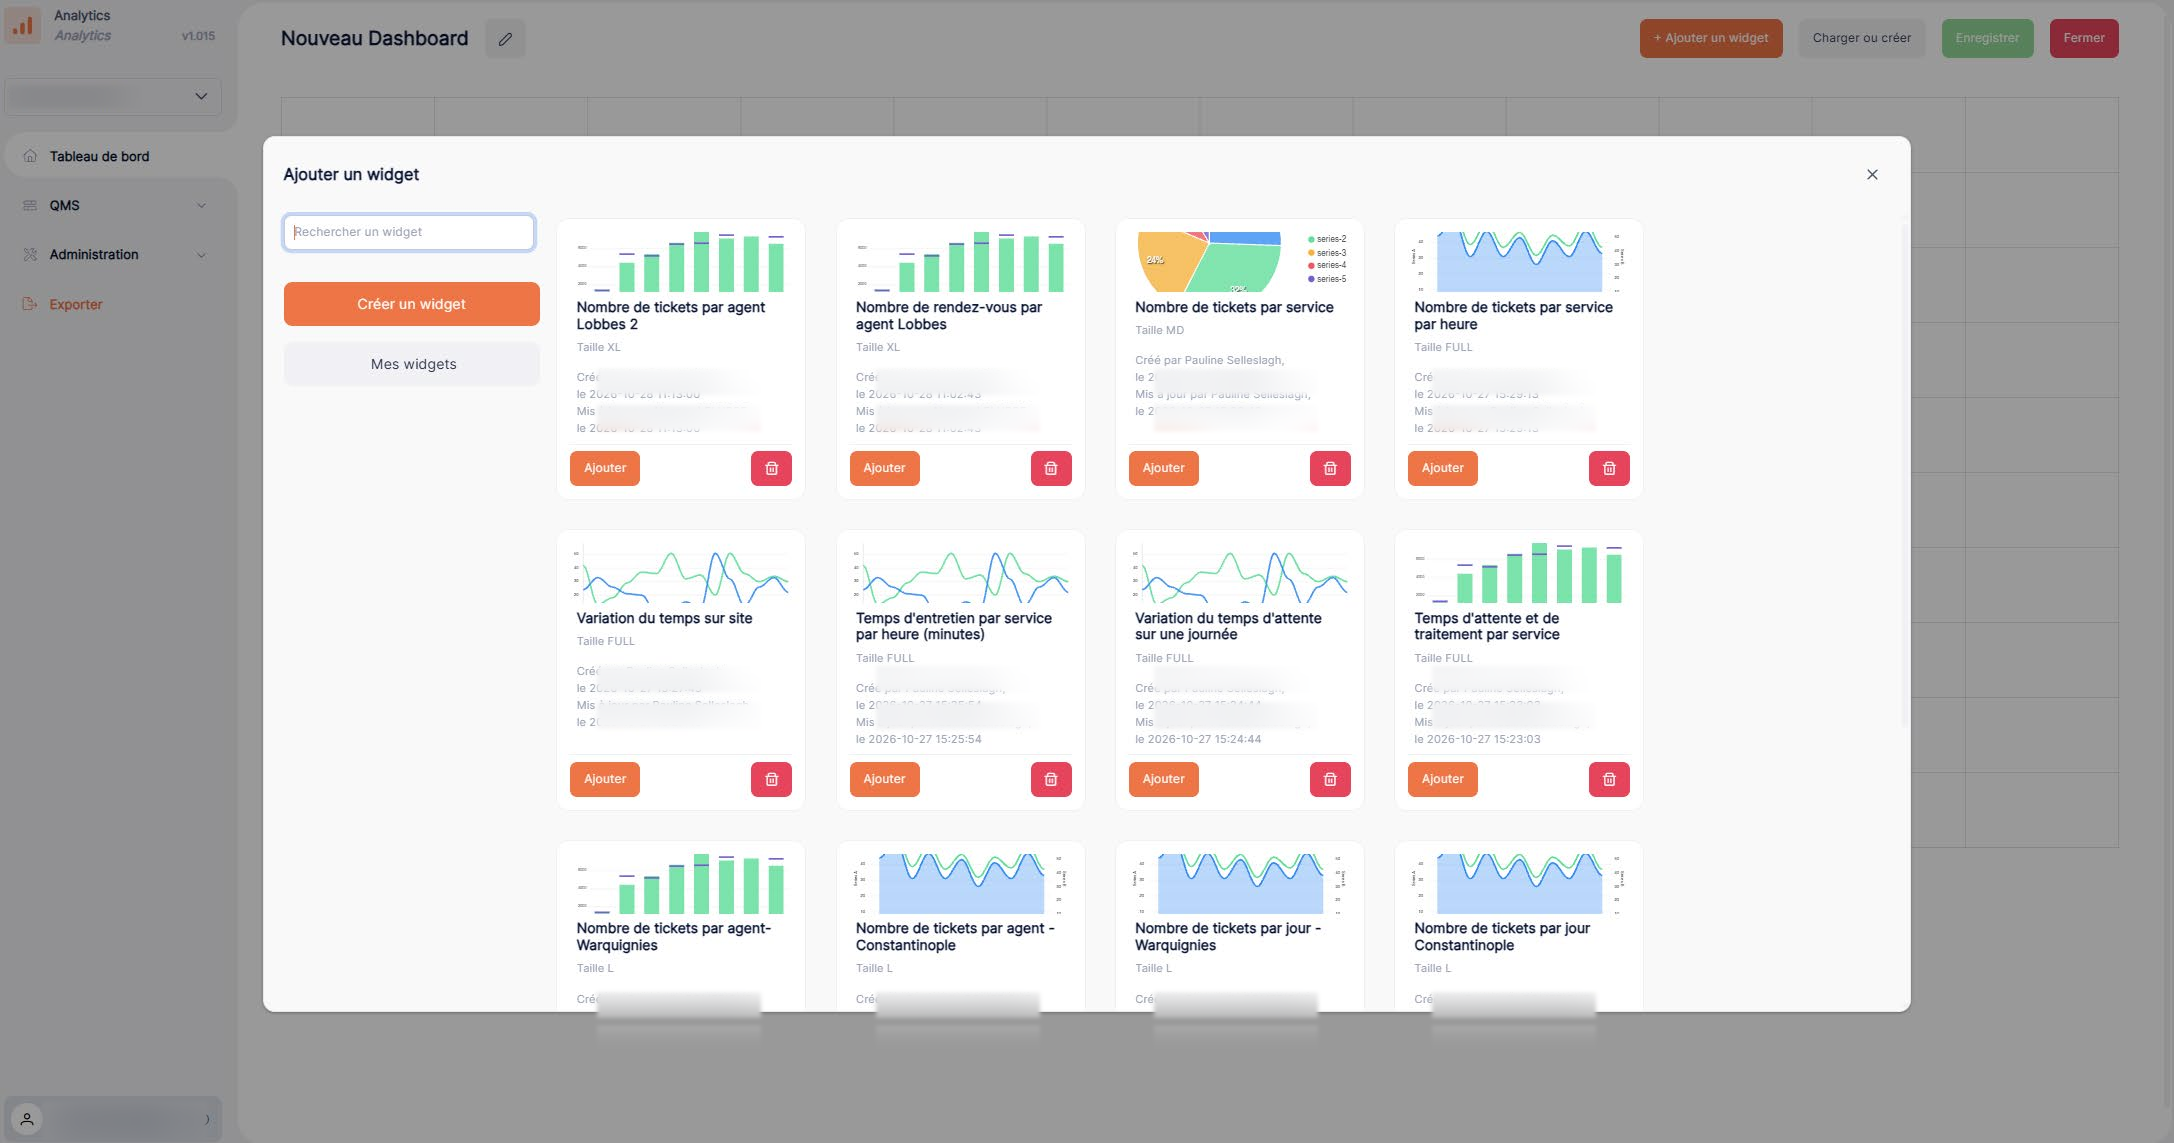
2. Enter the initial information
In the creation wizard, enter the initial information it requests.
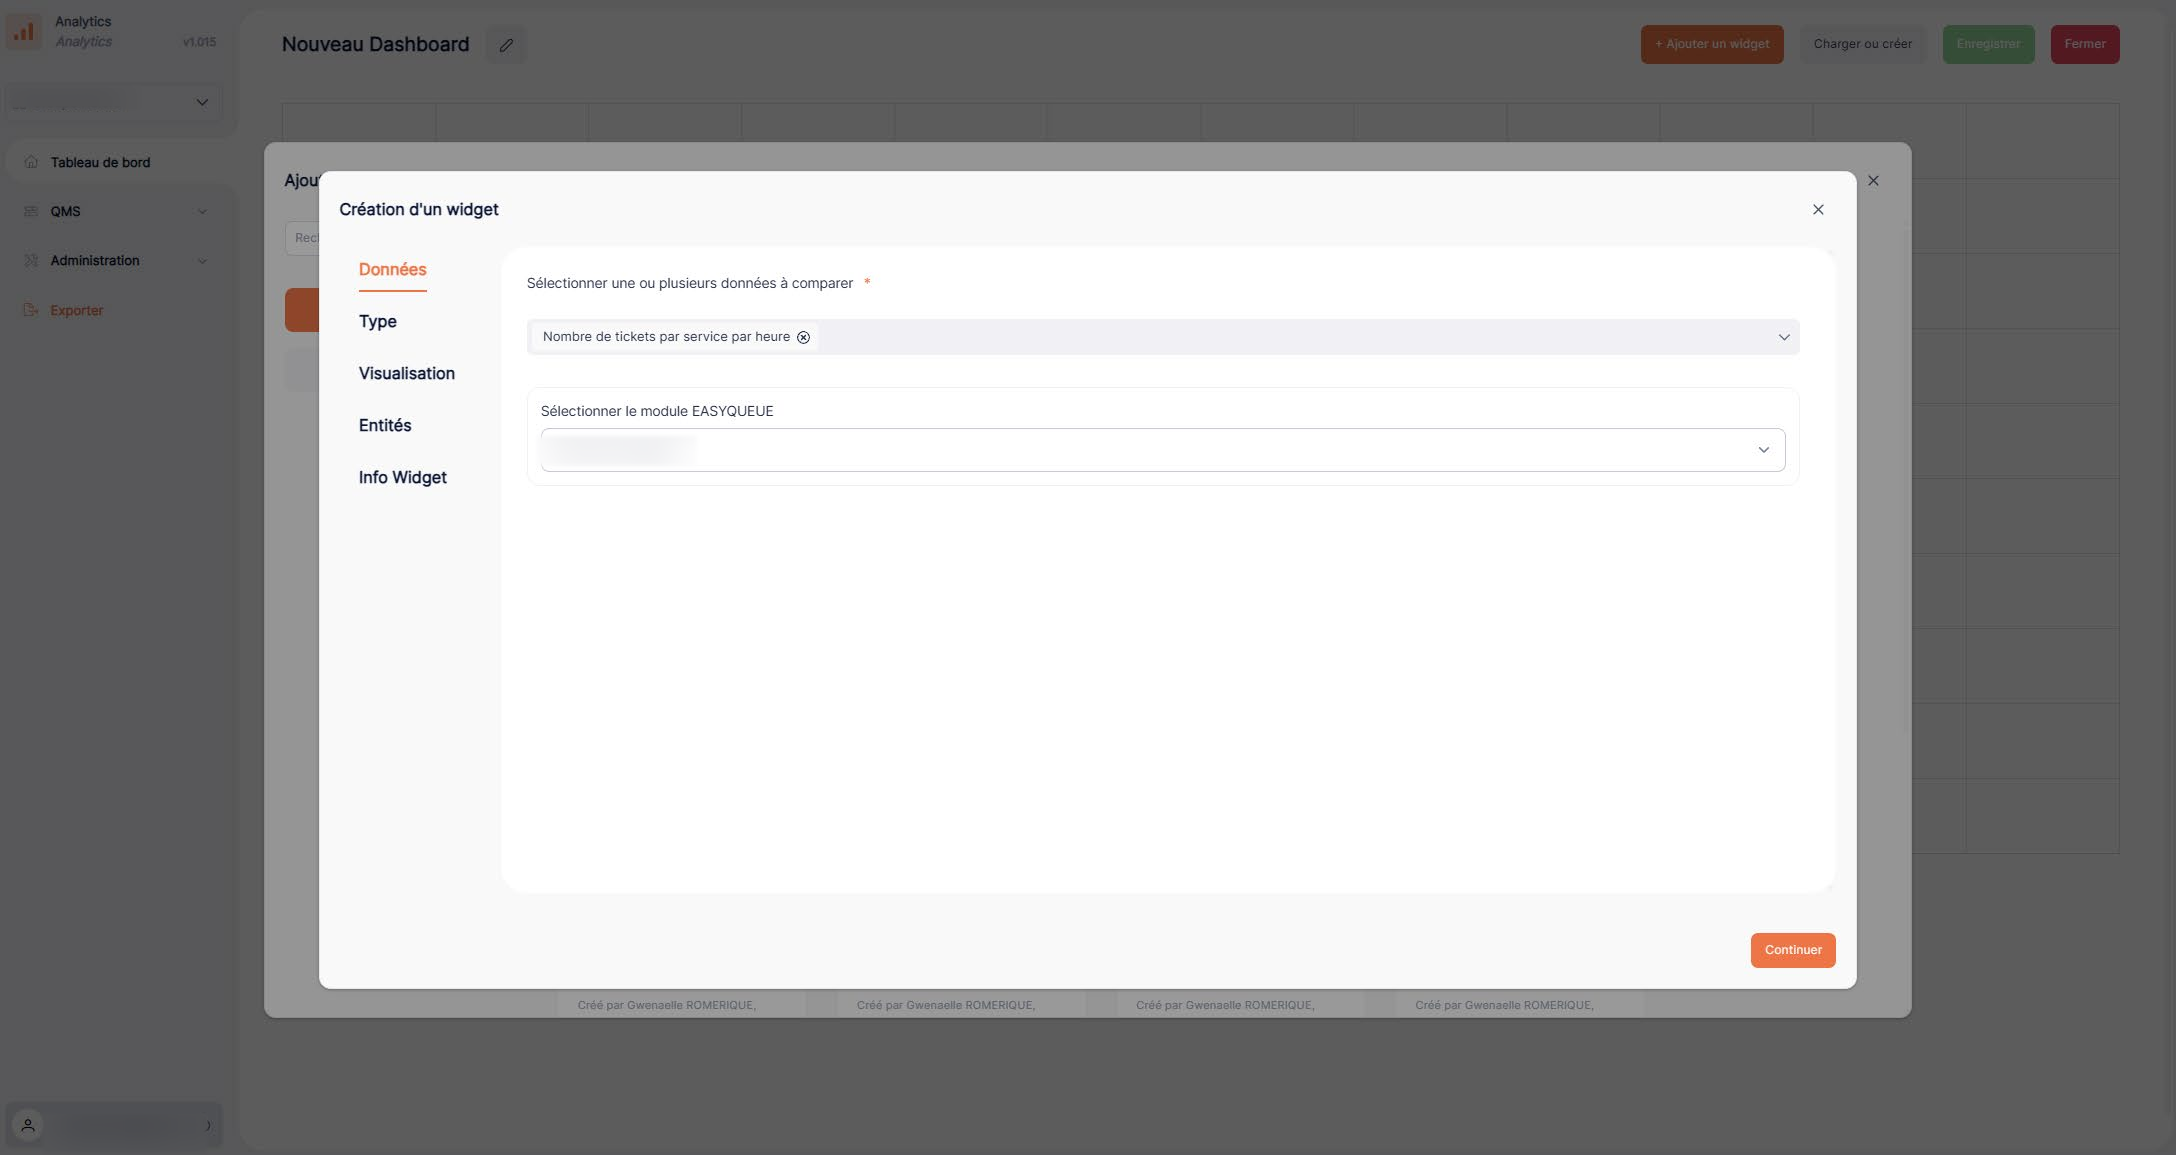
3. Select the data
Select the data type and the dimensions or measures to display, from the available options.
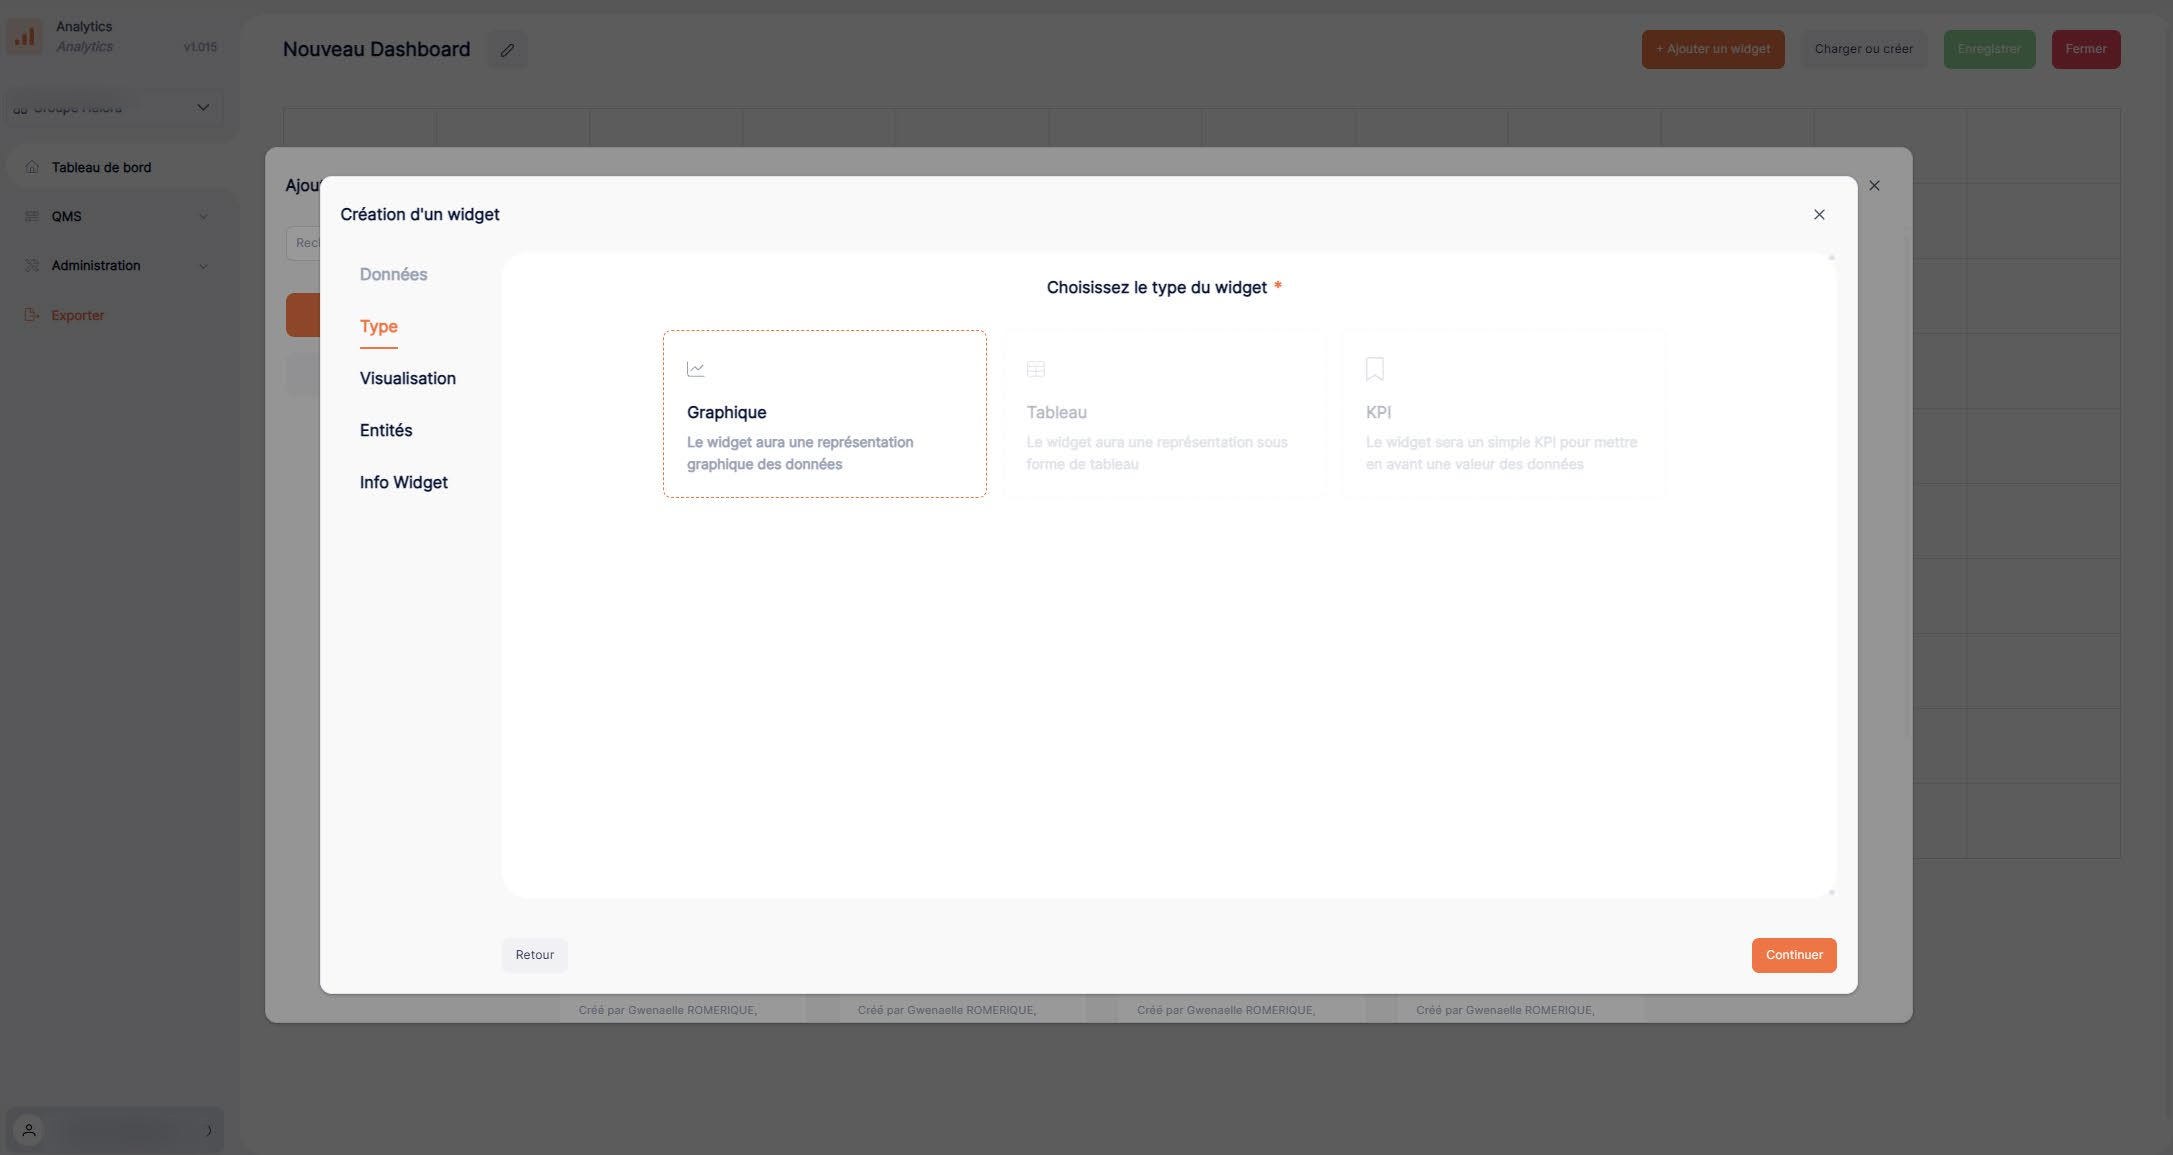
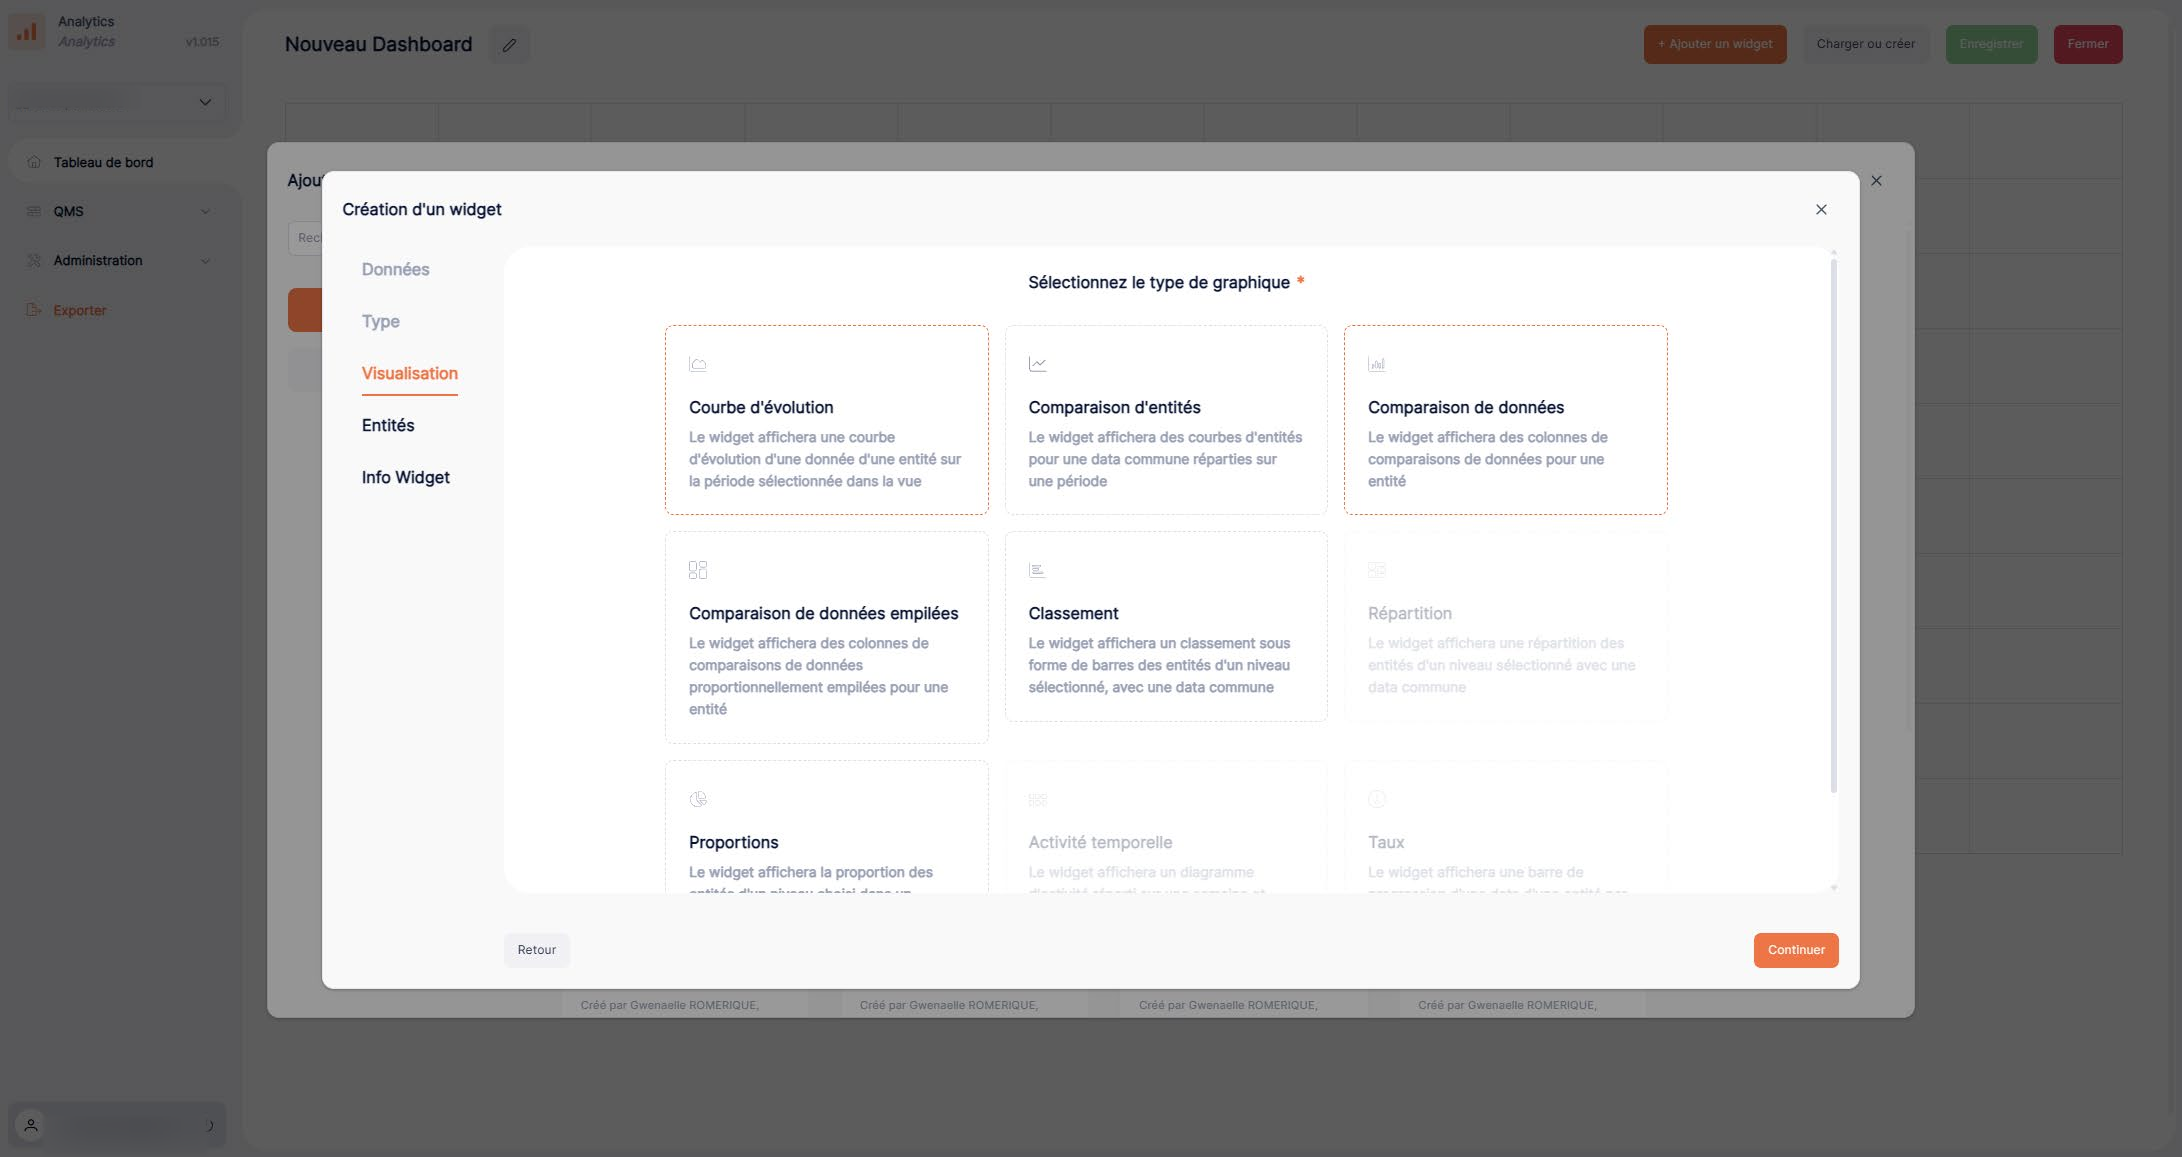
4. Configure filters
Configure the available filters and settings to refine the results.
5. Customize and confirm
Choose the widget's appearance, give it a clear name, and confirm its creation.
6. Check the display
Add the widget you created to the dashboard and check how it is displayed.