Agents view
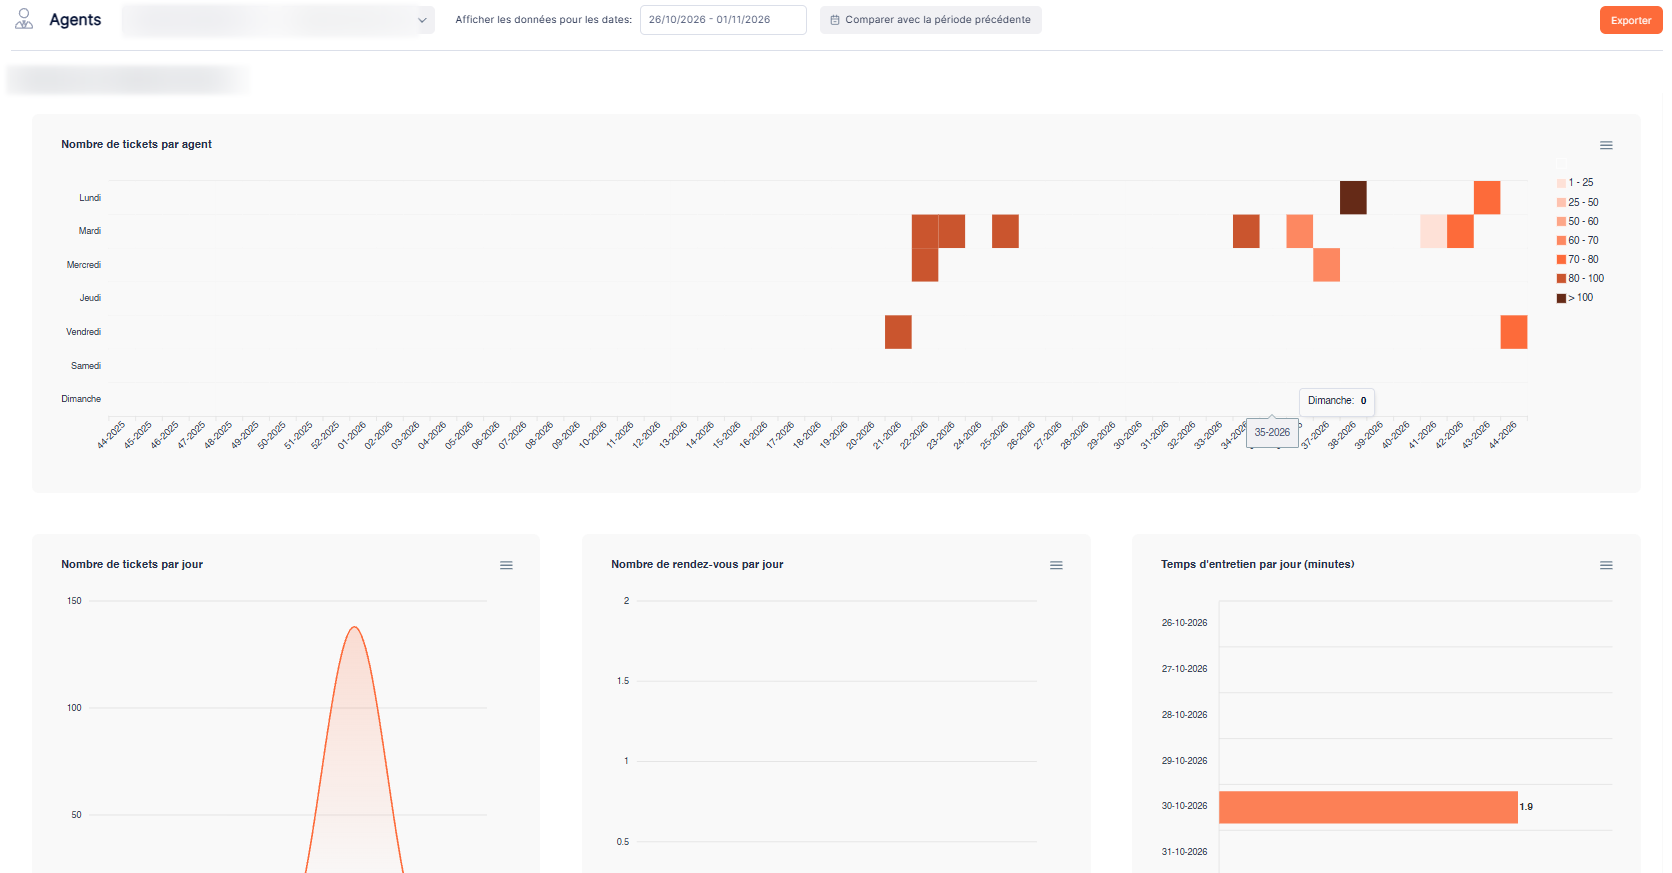
The Agents view displays charts and tables related to agents, based on the selected filters.
Use this view to analyze agent-related data within the selected scope:
- First check the service and period.
- Read the tables for detailed values.
- Use the charts to compare results or identify trends.
Before comparing agents, check that they are being analyzed under the same conditions.