View QMS statistics
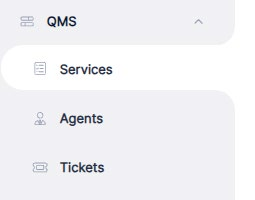
The QMS section provides predefined statistics in the form of charts, tables, and other visualizations. It contains three views: Services, Agents, and Tickets.
Filter the data before analyzing it
Select the relevant EasyQueue, service, and period or date to analyze. These filters are essential for avoiding comparisons across different scopes.
Recommended approach
- Choose the EasyQueue.
- Select the relevant service.
- Set the date or period.
- Open the view you want.
- Note these settings when sharing a result.
To compare two results, keep their scopes and periods consistent. A change in filters—not a change in activity itself—may explain a difference.