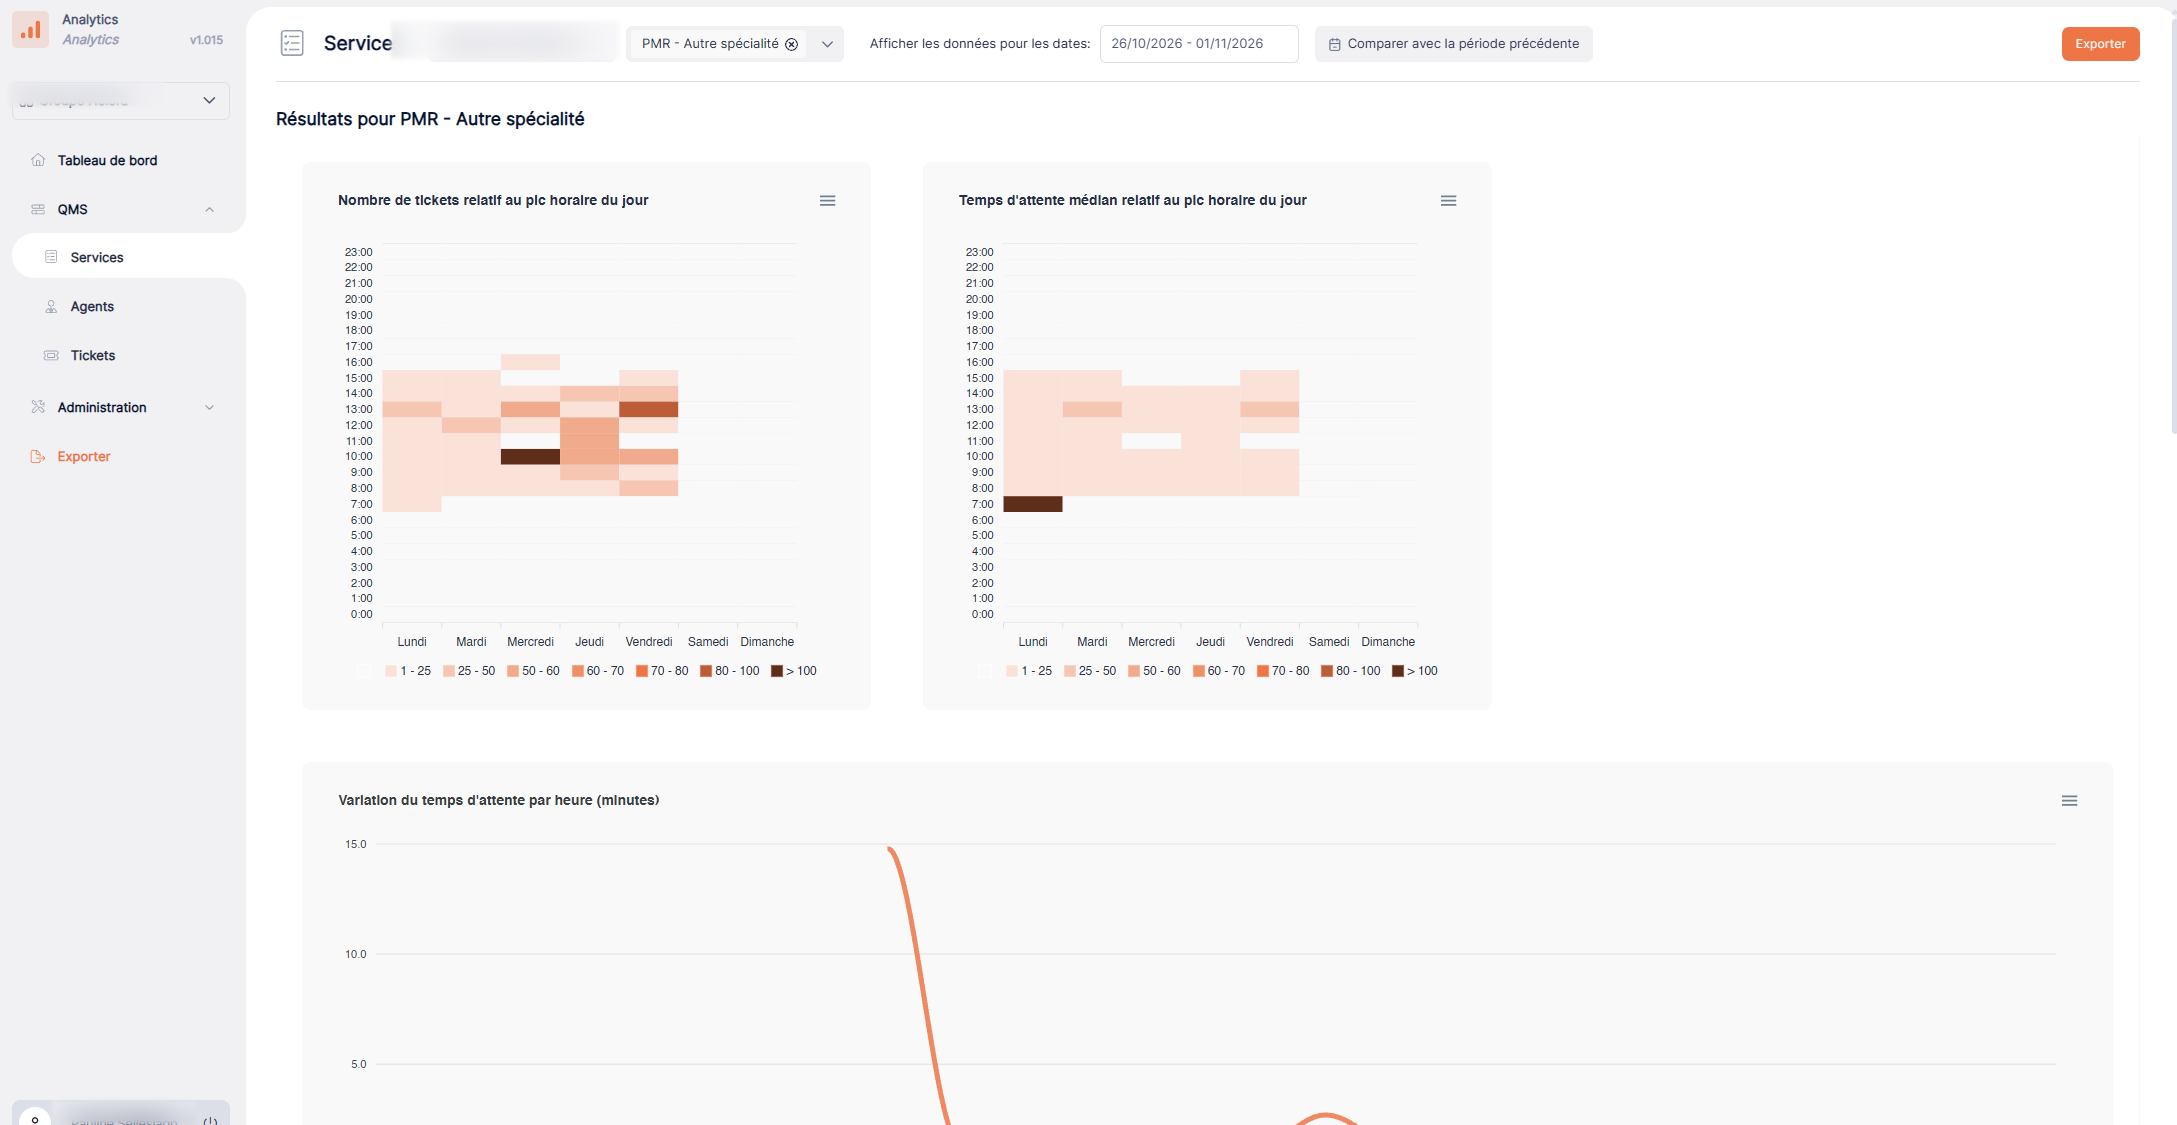
Services view
The Services view brings together several visualizations of service activity, including time-based charts, tables, and heat maps.
Use this view to examine activity for a service:
- Heat maps visually highlight areas of higher or lower intensity.
- Time-based charts help identify changes over time.
Check the labels and units on each visualization before interpreting its intensity or trend.